As Accountable Care Organizations (ACOs) prepare for the 2025 performance year, our ACO Quality Performance Score Calculator can help you estimate whether you’ll meet the 76.7% Quality Performance Standard needed to earn the maximum shared savings under Medicare CQMs:
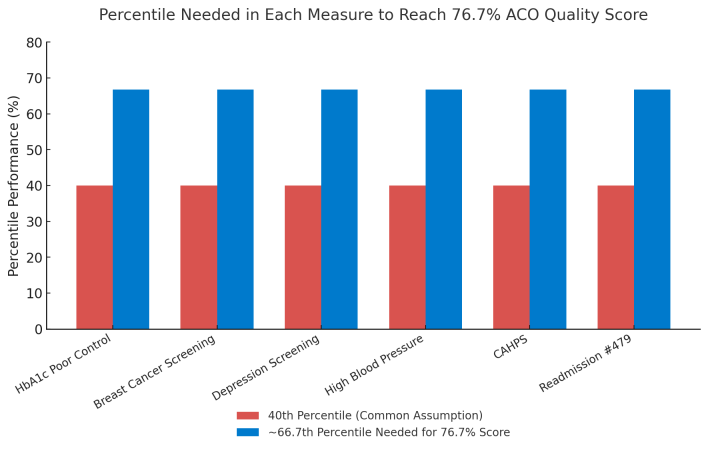
One of the biggest surprises for many ACOs is that reaching the 40th percentile in every quality measure does not equal a 40% ACO Quality Performance Score — and in fact, it can still mean losing half of your shared savings.
The 40% Misconception
The Quality Performance Score is not a simple average of your measure percentiles.
Instead:
Your measure performance (%) is converted into a MIPS score based on national benchmarks.
The six MIPS scores are averaged, then scaled into the ACO Quality Performance Score.
Because of the way MIPS scoring works, 40th percentile performance in each measure often translates to MIPS scores in the 5-point range — and the final ACO Quality Performance Score can fall well below the 76.7% target.
Example: The 40% Scenario
The example below uses 2025 benchmarks and assumes an ACO achieves the 40th percentile in 6 measures:
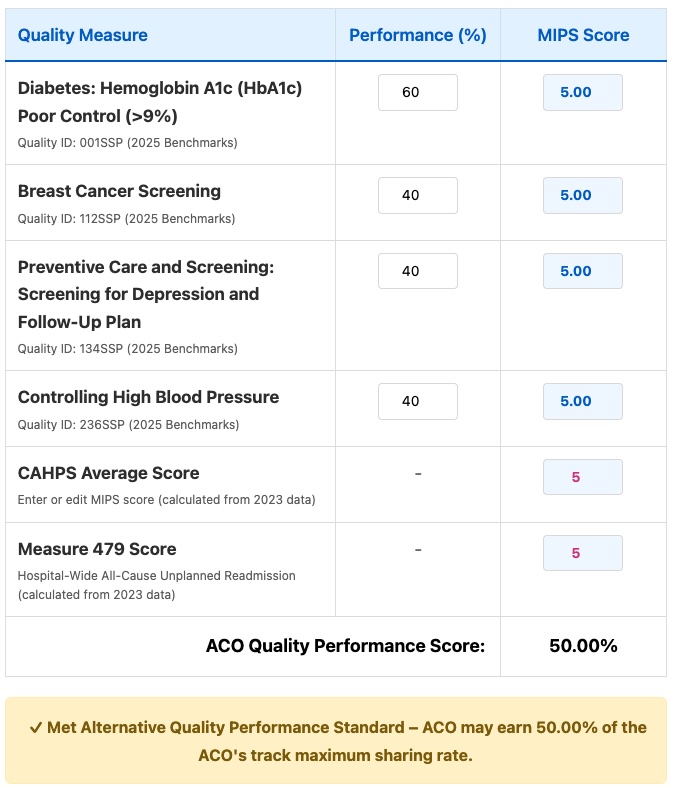
Result:
ACO Quality Performance Score = 50%
Status: Met Alternative Quality Performance Standard — earns only 50% of the track’s maximum sharing rate.
Distribution of Shared Savings Percentages for Web Interface ACOs
Using CMS-published 2023 Web Interface data as a baseline, we modeled how ACOs would fare under the 2025 Medicare CQM rules. The results are clear: not all ACOs that “passed” under the Web Interface will retain full shared savings in 2025.
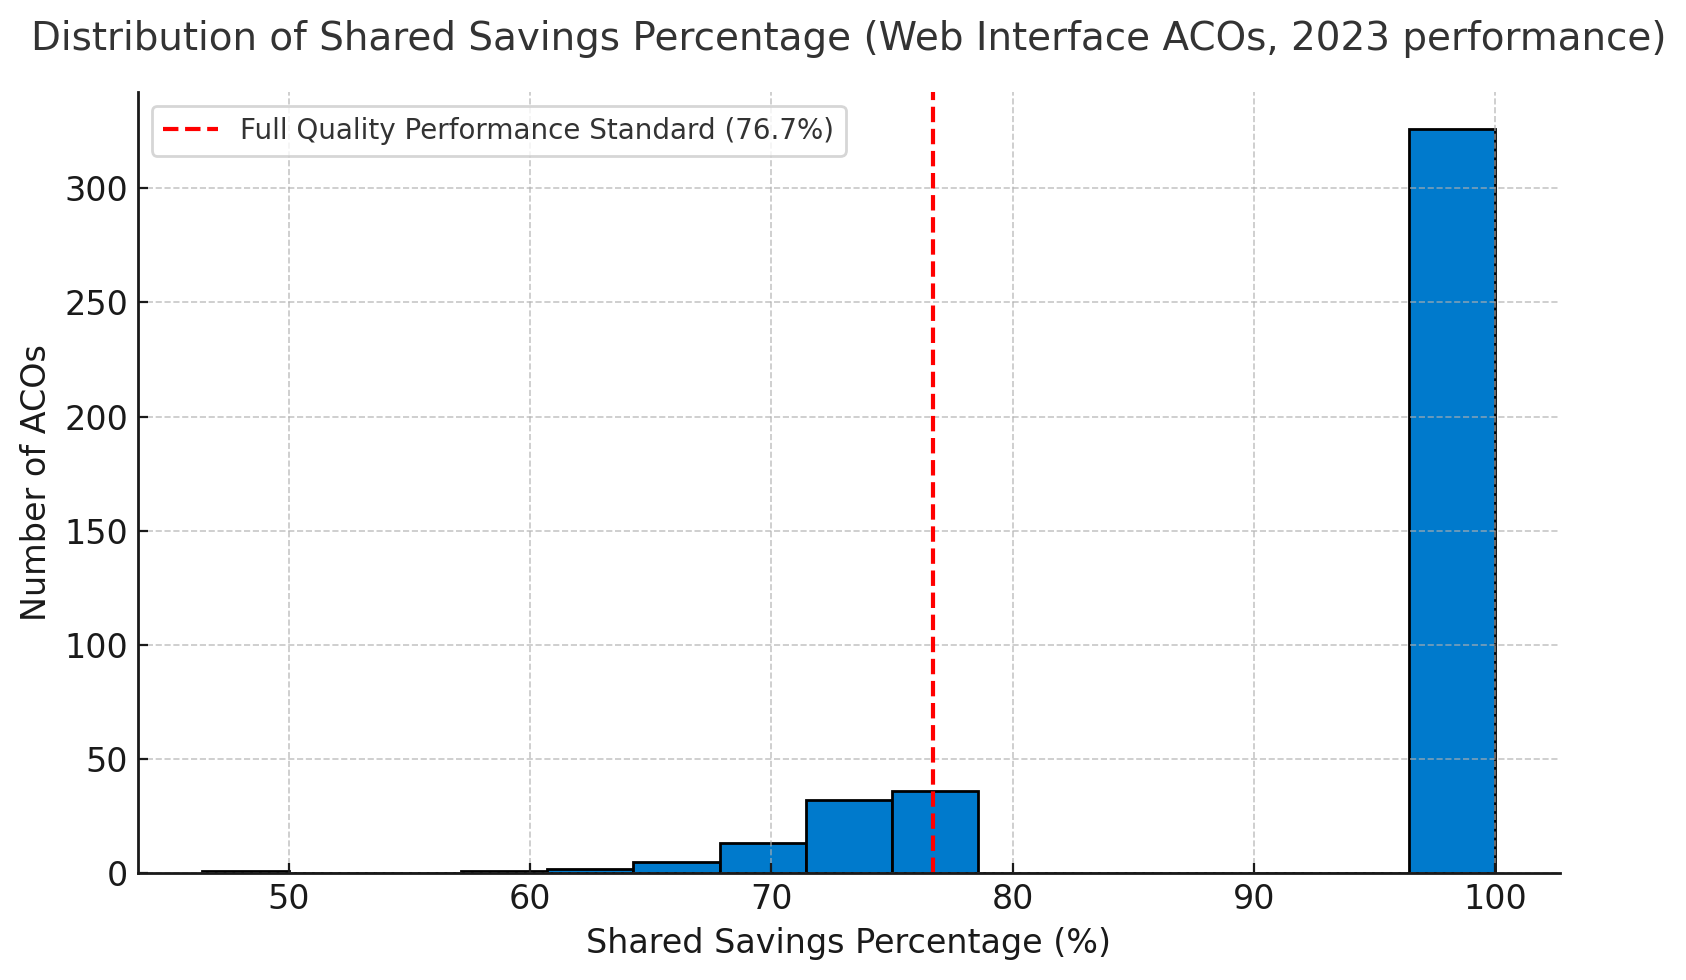
The chart above shows the distribution of Shared Savings Percentages across all ACOs that reported via the Web Interface in 2023. The red dashed line represents the 76.7% Quality Performance Standard required in 2025 to receive 100% of the maximum shared savings.
Key Takeaways
326 ACOs (78%) would meet the full standard (≥76.7%) and retain the maximum shared savings rate.
90 ACOs (21.5%) would only meet the Alternative Standard, receiving between 46% and 75% of the maximum possible shared savings depending on their individual quality score.
📉 Absolute impact:
For these 90 ACOs, the reduction in earned shared savings compared to 2023 ranges:
Average reduction: about $1.7 million per ACO
Median reduction: about $0.9 million per ACO
Range: from $163,500 to $9.4 million depending on ACO size and performance
Summary Table
| Category | Count | Percent of WI ACOs | Earnings Impact (Range) |
|---|---|---|---|
| Met Full Standard (≥76.7%) | 326 | 78.0% | Full (100% of maximum) |
| Met Alternative (<76.7%) | 90 | 21.5% | Only 46–75% of maximum → –$0.16M to –$9.4M (avg –$1.7M, median –$0.9M) |
Earnings Reductions for Alternative Standard ACOs
To better illustrate the financial risk, the chart below shows the distribution of earnings reductions among the 90 ACOs that would only meet the Alternative Standard:
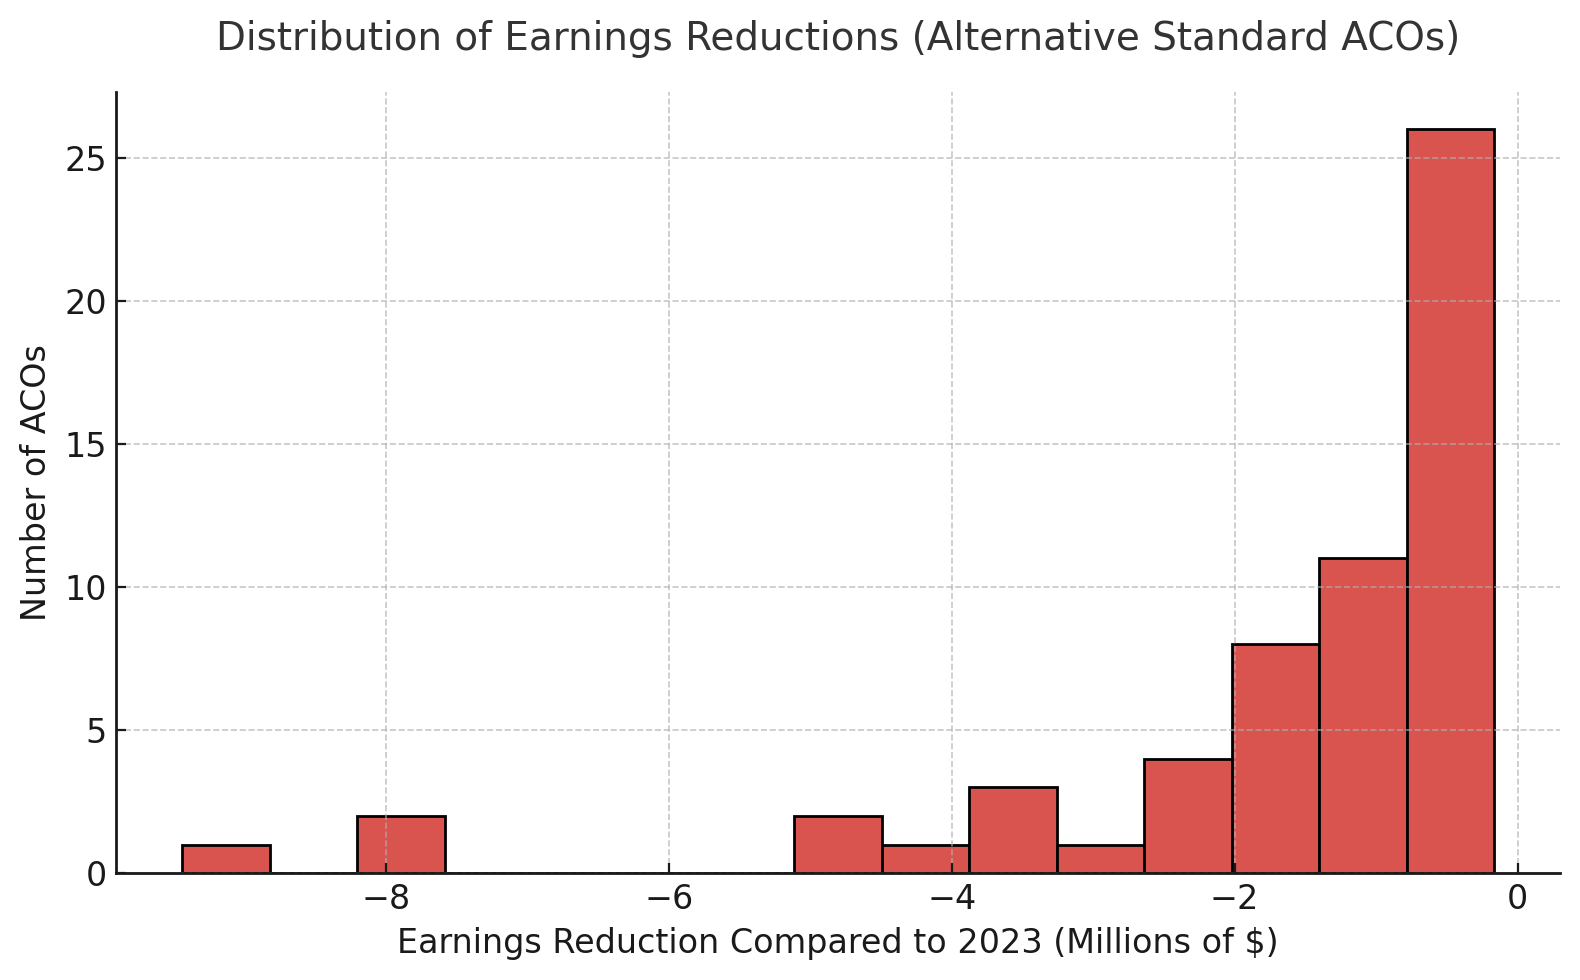
Most ACOs in this group face reductions under $2 million compared to 2023.
A smaller number of larger ACOs face cuts in the $5–9 million range.
The median reduction is about $0.9 million, meaning that for half of these ACOs, the lost earnings equal nearly a million dollars even when performance doesn’t worsen.
Bottom line: Nearly 1 in 5 ACOs risk losing substantial shared savings under 2025 Medicare CQM rules, even if their underlying expenditure performance remains the same as in 2023. The Alternative Standard is not a “safety net” — it is a scaled reduction mechanism that cuts deeply into ACO earnings.
Why MIPS CQMs/eCQMs Are More Forgiving
For ACOs reporting Medicare CQMS, all six measures must meet higher percentile thresholds to reach the 76.7% standard.
In contrast, MIPS CQMs or eCQMs only require:
One outcome measure at the 10th percentile or higher
One additional measure at the 40th percentile or higher
This flexibility makes CQMs/eCQMs statistically easier for some ACOs to pass — especially when adapting to the broader Medicare population.
Data Source & 2025 Challenges
Our calculator uses 2023 CMS Web Interface performance data from data.cms.gov as a baseline.
However, in 2025:
Medicare CQMs will require reporting for almost all Medicare patients who had an office visit with any of the ACO participants.
Populations will be larger and more diverse than 2023’s CMS web interface sample.
Performance rates may drop due to data completeness and operational changes.
For many ACOs, matching 2023 results will be difficult under full Medicare CQM reporting.
Next Steps for ACOs
Use preliminary data from your EHR or test CQM runs in the calculator.
Identify measures that need improvement now — don’t wait until submission.
Understand that hitting 40% in each measure is not enough if your goal is maximum shared savings.