
Trying to decipher how the Centers for Medicare & Medicaid Services (CMS) calculates your Merit-Based Incentive Payment System (MIPS) Cost category score? We understand - the Cost component of MIPS is complicated! Part 3 of our Mastering MIPS series breaks down the Cost category within the traditional MIPS program. In this article, you will learn about the different Cost measures, how Cost scores are calculated, and actionable steps you can take to improve your Cost performance.
Cost Category Overview
The MIPS Cost category measures a healthcare provider's ability to manage healthcare expenses effectively while providing high-quality care to patients. It represents 30 percent of the overall MIPS score in 2023, the same weight it held during the 2022 performance year. This weight can change for various reasons, including hardship exception applications, Alternative Payment Model (APM) Entity participation, or if the case minimum requirements are not met for at least one Cost measure.
The Cost category covers a 12-month reporting period (January 1, 2023, through December 31, 2023). Unlike other MIPS categories where clinicians select specific measures to report, the Cost category measures are calculated based on claims data without requiring additional data submission by clinicians.
What Effect Does the Cost Category Have on Overall Reporting Success?
The 2022 MIPS performance year was the first time that clinicians and groups received a score for the Cost category since 2019. CMS did not assign Cost scores to any MIPS eligible clinicians or groups in 2020 or 2021 due to the COVID-19 Public Health Emergency (PHE). While the Cost category was worth only 15 percent of the total MIPS score in 2019, it doubled to 30 percent by 2022. This increase in weight means that Cost now has a substantial impact on final MIPS scores.
CMS does not assign any Cost scores until after the MIPS submission period ends as scores are based on claims data collected during the performance period. This practice makes it challenging to predict the potential impact on overall MIPS scores until CMS releases the Performance Feedback during the summer. While the minimum threshold required to avoid penalties remains at 75 MIPS points, it's important to note that the maximum possible score for the three reportable MIPS categories (Quality, Improvement Activities, and Promoting Interoperability) is 70 MIPS points. As a result, a low Cost score can prevent clinicians or groups from reaching the minimum performance threshold, leading to a reduction in their Medicare reimbursement.
What are the Cost Measures?
There are 25 Cost measures available for the 2023 performance year, which include two population-based measures and 23 episode-based measures. Clinicians and groups can be scored on a Cost measure if they meet or exceed the measure’s case minimum requirements.
The 2023 Cost measures and case minimum requirements are listed in the table below (click the name of the measure to view the CMS measure specifications).
Population-based Cost Measures
There are two population-based measures in 2023: the Total Per Capita Cost (TPCC) measure and the Medicare Spending Per Beneficiary (MSPB) Clinician measure.
- TPCC - The TPCC measures the overall cost of care delivered to a patient with a focus on the primary care they receive from their healthcare provider(s).
- MSPB - The MSPB measure concentrates on the expenses associated with inpatient medical care. It assesses the cost to Medicare of services provided to a patient during an MSPB clinician episode, which comprises the period immediately prior to, during, and following the patient’s hospital stay.
Episode-based Cost Measures
Episode-based cost measures demonstrate the expenses that Medicare incurs for the services and items provided to a patient during a specific period of care (called an “episode”). There are 23 episode-based measures that are based on a range of procedures, inpatient conditions, and chronic conditions.
- Procedural episode-based measures - There are 15 procedural episode-based measures that assess the cost of care that’s clinically related to a specific procedure provided during an episode’s timeframe.
- Acute inpatient medical condition episode-based measures - There are six acute inpatient medical condition measures that assess the cost of care that’s clinically related to specific acute inpatient medical conditions and provided during an episode’s timeframe.
- Chronic condition episode-based measures - There are two chronic condition measures that assess the cost of care that’s clinically related to the care and management of patients’ specific chronic conditions provided during a total attribution window divided into episodes.
MVPs
Clinicians reporting a new MIPS Value Pathway (MVP) will be scored on a subset of Cost measures if they meet the applicable case minimum requirements. The Cost measures vary within the different MVPs. More information about MPVs and the Cost measures associated with each one can be found here.
How are Cost Measure Scores Calculated?
Cost measures can earn between one to 10 points based on the clinician or group’s performance compared to a performance period benchmark. CMS establishes a national benchmark for each Cost measure. The benchmarks are based on performance year data (there are no historical benchmarks).
CMS compares a clinician or group’s performance (expressed as a dollar amount) on each Cost measure to the performance period benchmark(s) and then assigns points to each measure based on that comparison. A list of the 2022 Cost measure benchmarks can be found here.
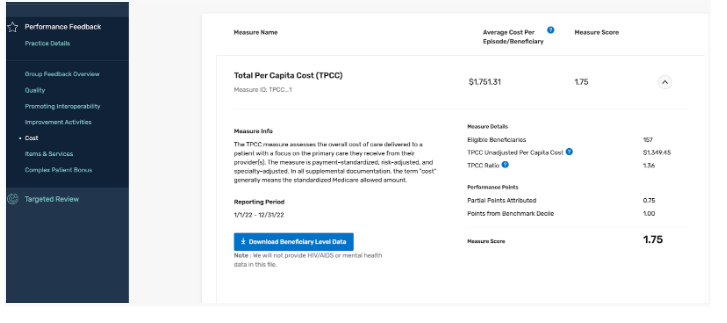
In the 2022 TPCC scoring example below, the clinician’s average cost per beneficiary/episode is much higher than the national average per capita cost resulting in a lower measure score (1.75 points out of a maximum of 10 possible points).
| Cost Measure | Average Cost Per Beneficiary/Episode | National Average Per Capita Cost | Measure Score |
|---|---|---|---|
| Total Per Capita Cost (TPCC) | $1,751.31 | $1,284.88 | 1.75/10 pts |
The performance feedback for all Cost measures will show this information in more detail, including the number of Medicare beneficiaries who contributed to the Cost measure calculation:
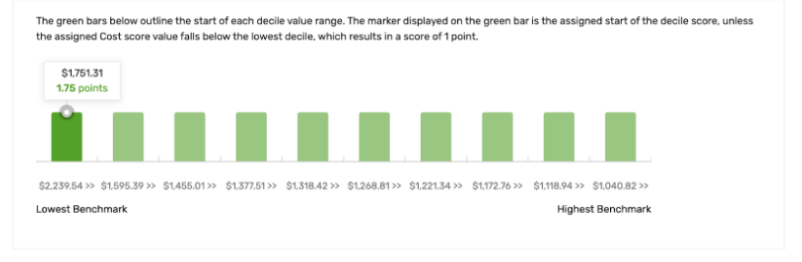
The number of points a clinician or group receives for each Cost measure will be determined by the decile range within which their performance on the measure lies. A lower decile for the measure score indicates higher relative care costs compared to others as illustrated in the graph below.
Attribution and Risk Adjustment
To calculate Cost scores, CMS attributes the costs of a Medicare beneficiary’s treatment to a specific clinician or group based on certain criteria. These criteria consider factors like primary care services provided by the clinician, the frequency of services, and the patient's relationship with the clinician. Once beneficiaries are attributed, CMS analyzes the claims data to track the services provided to these beneficiaries during a specific performance period. The services can include hospital visits, procedures, tests, prescription drugs, and other relevant healthcare activities. Each Cost measure has its own method for attributing costs. CMS releases patient-level reports of the attributed beneficiaries and their associated cost of care that contribute to the calculation of the Cost scores.
CMS also risk adjusts all of the Cost measures to account for differences in patient health status and complexity. Hierarchical Condition Categories (HCC) Scores play a significant role in the MIPS Cost Category by providing a mechanism for risk adjustment. The HCC risk score provides an estimate of the expected healthcare costs for each patient based on their health conditions and other factors. This ensures that clinicians are fairly evaluated based on the severity of their patient population and enables a more accurate assessment of their cost performance within the program.
The 2023 MIPS Cost Measure Code Lists details the codes used in the specifications for each of the 25 Cost measures for attributing patients or episodes to a clinician or group.
Improvement Scoring
Clinicians and groups can also earn up to 1 percentage point for improvement scoring for this category for 2023.
How Do I Access My 2022 MIPS Cost Scores and Patient-Level Reports?
The final Performance Feedback released over the summer breaks down the Cost measure scores for those clinicians and groups who met the case minimum for any measures. Information on how to access your final MIPS scores and payment adjustment information can be found here.
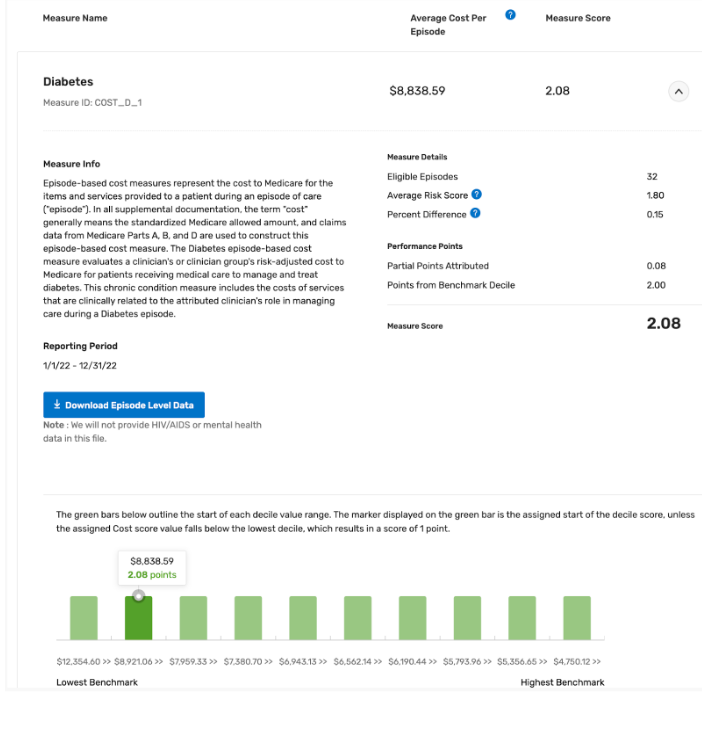
Below is an example of how the Performance Feedback breaks down the score for the Diabetes Cost measure.
The Performance Feedback will include patient-level reports of the patients who were part of the Cost score calculations. The patient-level reports can be accessed by following the steps below:
- Log into your QPP HARP account
- Click “Performance Feedback” in the left-hand navigation pane and then “View PY 2022 Final Performance Feedback”
- Click “Cost”
- Click “Download Beneficiary Level Data” or “Download Episode Level Data”
How to Optimize Your Cost Category Performance
While clinicians have no reporting requirements for the Cost category, there are still actionable steps they can take to influence their overall Cost performance.
- Evaluate Past Performance: Review your 2022 Performance Feedback which includes detailed information about Cost scores. If you met the case minimum requirements for any Cost measures and received a score in this category, you should carefully review your Performance Feedback, including the patient-level reports. These reports include details for every cost measure on which you could be scored.
- Ensure Accurate Diagnosis Coding: Ensure your staff is using diagnosis codes that accurately reflect the complexity of your patients. The hierarchical condition category relies on ICD-10 coding to assign risk scores to patients. Each HCC is mapped to an ICD-10 code. A patient with multiple chronic conditions is expected to have higher healthcare utilization and costs. For example, a Type 2 Diabetes patient with no Complications (ICD10 E11.9) has a lower risk score than a Type 2 Diabetes patient with diabetic polyneuropathy (ICD10 E11.42). CMS calculates the risk scores each year based on the diagnosis submitted during the reporting year. If a patient has diabetic polyneuropathy but CMS didn’t get the correct ICD10 during the current performance year, the risk score will not be adjusted by CMS.
- Analyze Claims Data: Regularly review your claims data to understand cost patterns, identify areas of high expenditure, and pinpoint potential cost-saving opportunities. Assess whether tests, procedures, and treatments are necessary for the patient's condition. Unnecessary or redundant services can drive up costs without adding value.
- Focus on Care Coordination: Clinicians who better coordinate care can improve health outcomes while ensuring quality health care is provided in appropriate settings. Take steps to emphasize care coordination among healthcare providers, including specialists, primary care clinicians, and hospitals. Effective communication and collaboration can prevent duplicate tests, reduce hospital readmissions, and minimize overall costs.
- Minimize Emergency Visits and Readmissions: Educate patients about appropriate care levels, offering options like same-day visits, telehealth, or after-hours lines. Hospital Admission/Discharge/Transfer (ADT) notifications help clinicians stay informed about patient status, enabling timely interventions and reducing overutilization.
- Chronic Disease Management: Prioritize effective management of chronic conditions to prevent complications and hospitalizations, ultimately reducing long-term costs.
The MIPS Cost category now plays a significant role in determining your overall MIPS reporting success, making it even more important to understand the different Cost measures and how they impact your performance. The first step is to check your 2022 Final Performance Feedback, including the patient-level reports, to determine if you received a score for any Cost measures during the previous performance year. If your Cost score is low, consider implementing strategies to better manage healthcare expenses and, in turn, improve your future Cost performance.